The one concept that will make Machine Learning click : Gradient descent explained for the 'I don't get it' Brigade
Gradient descent pops up everywhere, from linear regression to logistic regression and classification problems. Might as well get to know it!
WHY?……
It’s always important to understand why we should learn something. If we truly asked that question, half of us wouldn’t be enrolled in college right now. Just like the descent of Will Smith’s career currently, gradient descent is an algorithm that's used everywhere. It forms the basis of almost everything. Understanding gradient descent will provide a strong foundation for more advanced concepts in ML.
Introduction
Here’s a super simple example to understand gradient descent using linear regression. (For those who don’t know, linear regression is basically about finding the best-fitting line on a graph.) If you want to learn more about linear regression, here’s an article I wrote that you can check out.
In this case, gradient descent helps optimize the model by finding the line of best fit. Given the x and y values, the goal is to determine the intercept and slope (m) that create this line of best fit.
Line of Best Fit
To determine the line of best fit , we have to minimize the distance between data points and our line of best fit. This distance has a name ,residual, we have to reduce the sum of squared residual. This is essentially a fancy term that ensures each point is closer to the line of best fit as a whole. Now lets take only y-intercept and modify its value to see if we can reduce the sum of squared residual (SSR). If we reduce SSR that means we have essentially brought out line closer to all data points, which essentially means you have found the line of best fit, which essentially means you are smarter than a 6th grader. 🥳
But how do we reduce SSR? As humans, we can look at the graph, adjust the y-intercept, and see if the line is getting closer to the data points to find the best y-intercept. However, a computer, even though infinitely smarter than you, is blind and poor thing relies on numerical data. One thing we can do is feed it y intercept values and it can deduce which y-intercept value is getting SSR close to 0.
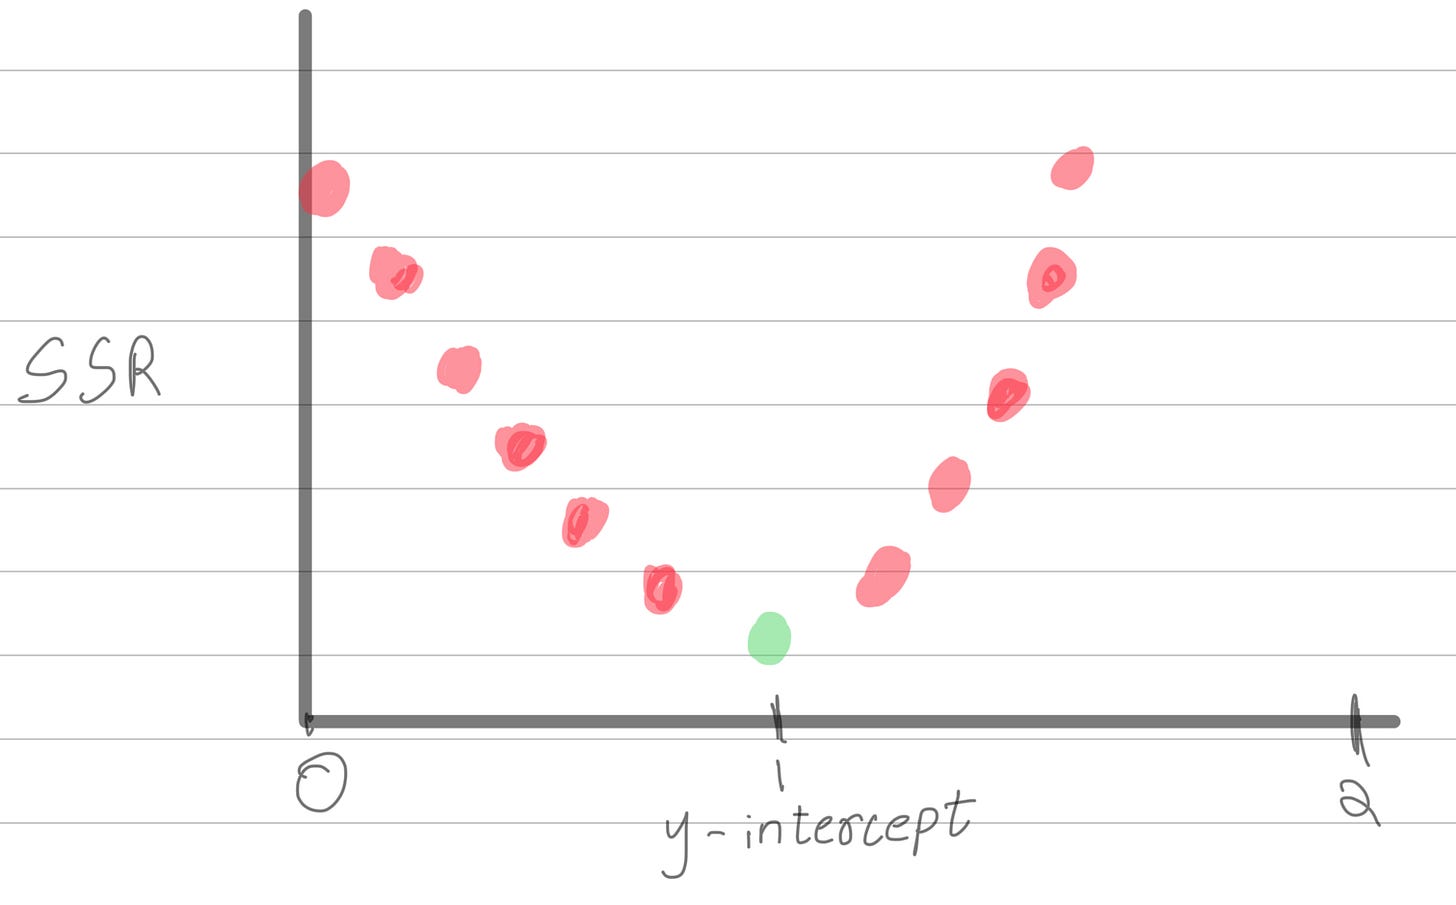
Here’s a graph that shows SSR versus the y-intercept. For those with the attention span of a goldfish, SSR is essentially a measure of how far the data points are from the line of best fit. The green dot on the graph represents the line of best fit. While plotting all y-intercept values to find a low SSR might seem intuitive, this approach isn’t practical for big data.
Gradient Descent
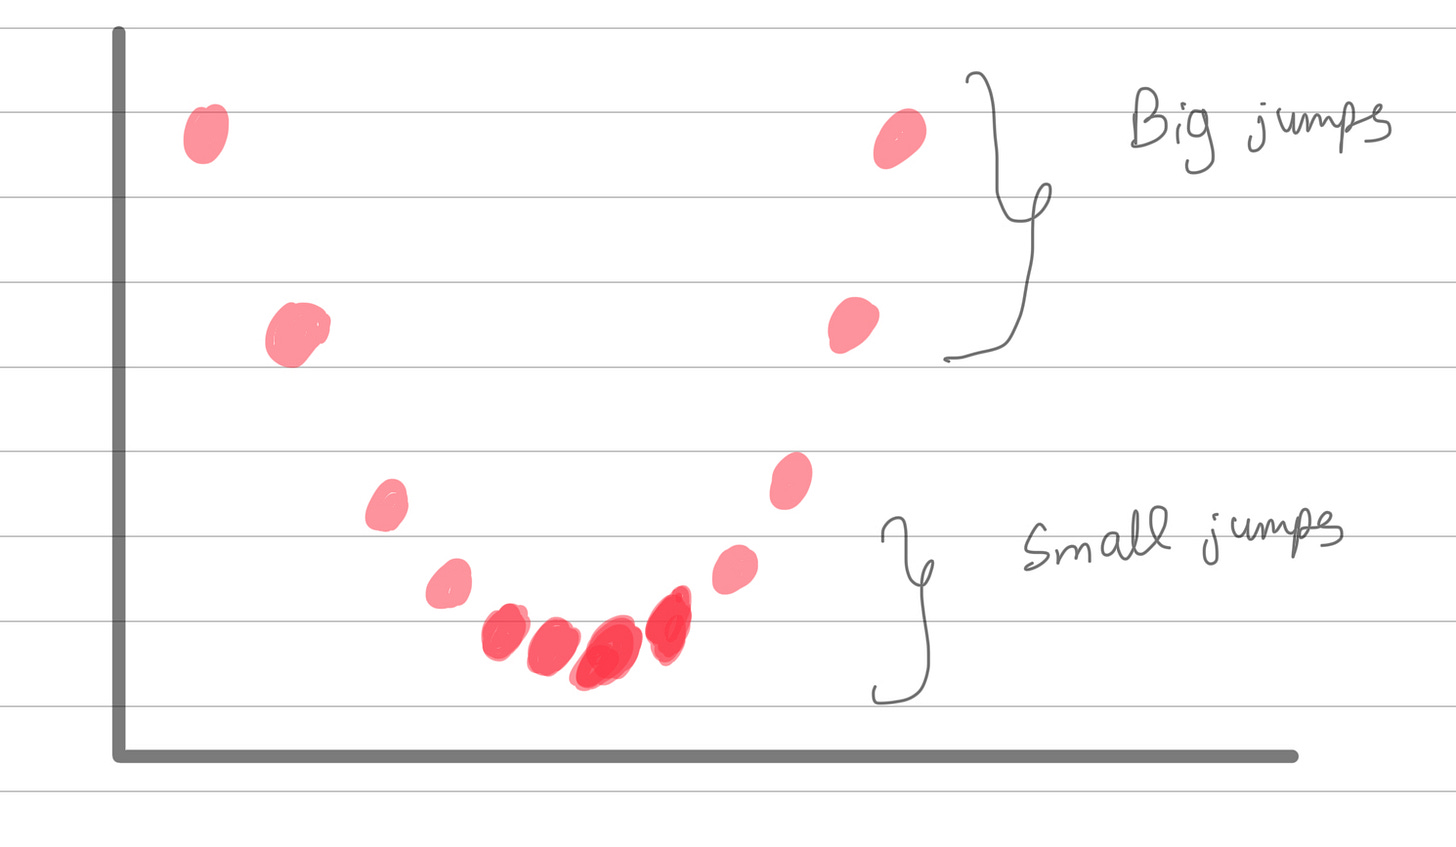
As you can see, the idea behind gradient descent is to make big leaps when we realize our SSR is high (meaning we're far from the desired result). As we start to reduce the SSR significantly, we slow down and make smaller adjustments until we find the point with the lowest possible SSR, thus determining the best y-intercept. This gradual descent is why it's called gradient descent. That’s the gist of gradient descent! If your CET ranking is not similar to your phone no and if you can understand simple derivatives, keep reading to dive into the math behind it.
Math
y = y - L (dJ(y)/dy)
here,
y is the parameter we are adjusting (y-intercept in this case)
L is the learning rate
J - cost function ( SSR )
(dJ(y)/dy) - the slope of the cost function (goal is to get it to zero)
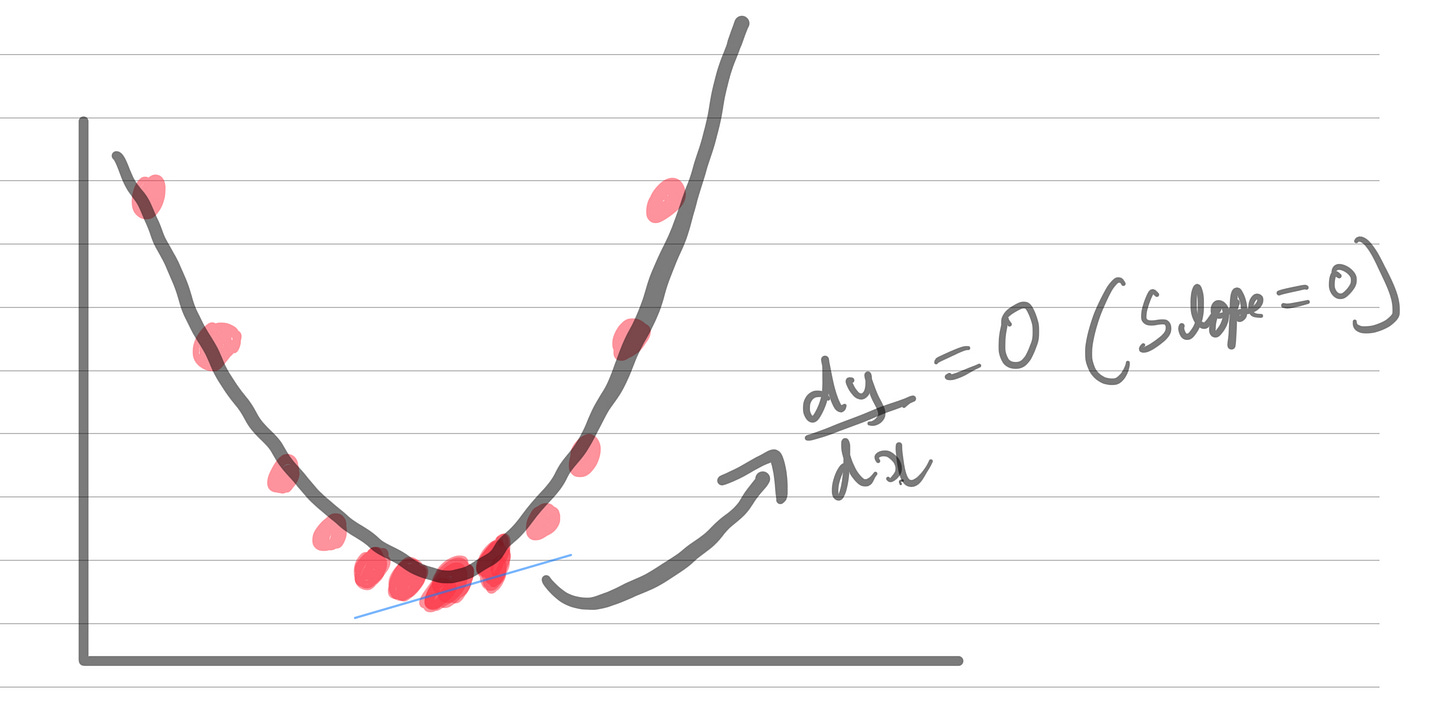
derivate essentially finds the slope of a function. slope is zero for curves that involve maxima and minima. In this case our goal is find values that ensures (dJ(y)/dy) is 0 and that is in our minima (SSR IS MINIMAL HERE).
Conclusion
Voila! Thanks for bearing through the arduous explanation , I’m open to comments and suggestions.


